Monitor Sensu with Sensu
This guide describes best practices and strategies for monitoring the Sensu backend with another Sensu backend or cluster.
To completely monitor Sensu (a Sensu backend with internal etcd and an agent), you will need at least one independent Sensu instance in addition to the primary instance you want to monitor. The second Sensu instance will ensure that you are notified when the primary is down and vice versa.
This guide requires Sensu plugins using dynamic runtime assets. For more information about using Sensu plugins, read Use dynamic runtime assets to install plugins.
NOTE: Although this guide describes approaches for monitoring a single backend, these strategies are also useful for monitoring individual members of a backend cluster.
This guide does not describe Sensu agent keepalive monitoring.
The checks in this guide monitor the following ports and endpoints:
| Port | Endpoint | Description |
|---|---|---|
| 2379 | /health |
Etcd health endpoint. Provides health status for etcd nodes. |
| 8080 | /health |
Sensu Go health endpoint. Provides health status for Sensu backends, as well as for PostgreSQL (when enabled). |
Requirements
To follow this guide, install the Sensu backend, make sure at least one Sensu agent is running, and configure sensuctl to connect to the backend as the admin user.
Register dynamic runtime asset
To power the checks to monitor your Sensu backend, external etcd, and PostgreSQL instances, add the sensu/http-checks dynamic runtime asset.
This asset includes the http-json plugin, which your checks will rely on.
To register the sensu/http-checks dynamic runtime asset, run:
sensuctl asset add sensu/http-checks:0.5.0 -r http-checksThe response will confirm that the asset was added:
fetching bonsai asset: sensu/http-checks:0.5.0
added asset: sensu/http-checks:0.5.0

You have successfully added the Sensu asset resource, but the asset will not get downloaded until
it's invoked by another Sensu resource (ex. check). To add this runtime asset to the appropriate
resource, populate the "runtime_assets" field with ["http-checks"].
This example uses the -r (rename) flag to specify a shorter name for the dynamic runtime asset: http-checks.
To confirm that the asset is ready to use, run:
sensuctl asset listThe response should list the renamed http-checks dynamic runtime asset:
     Name                                       URL                                    Hash
────────────── ───────────────────────────────────────────────────────────────────── ──────────
  http-checks   //assets.bonsai.sensu.io/.../http-checks_0.5.0_linux_armv7.tar.gz     b28f8c3
  http-checks   //assets.bonsai.sensu.io/.../http-checks_0.5.0_linux_arm64.tar.gz     7308f9c
  http-checks   //assets.bonsai.sensu.io/.../http-checks_0.5.0_linux_386.tar.gz       6457583
  http-checks   //assets.bonsai.sensu.io/.../http-checks_0.5.0_windows_amd64.tar.gz   b936ca0
  http-checks   //assets.bonsai.sensu.io/.../http-checks_0.5.0_darwin_amd64.tar.gz    38e6cb8
  http-checks   //assets.bonsai.sensu.io/.../http-checks_0.5.0_linux_amd64.tar.gz     bc5fc3b
Because plugins are published for multiple platforms, including Linux and Windows, the output will include multiple entries for each of the dynamic runtime assets.
NOTE: Sensu does not download and install dynamic runtime asset builds onto the system until they are needed for command execution.
Monitor your Sensu backend instances
Monitor the host running the sensu-backend locally by a sensu-agent process for operating system checks and metrics.
For Sensu components that must be running for Sensu to create events, you should also monitor the sensu-backend remotely from an independent Sensu instance.
This will allow you to monitor whether your Sensu event pipeline is working.
To do this, add checks that use the http-json plugin from the sensu/http-checks dynamic runtime asset to query Sensu’s /health API for your primary (Backend Alpha) and secondary (Backend Beta) backends.
NOTE: These examples use the sensu/http-checks dynamic runtime asset. Follow the instructions above to register sensu/http-checks if you have not previously registered it.
cat << EOF | sensuctl create
---
type: CheckConfig
api_version: core/v2
metadata:
  name: check_beta_backend_health
spec:
  command: http-json --url http://sensu-backend-beta:8080/health --query ".ClusterHealth.[0].Healthy" --expression "== true"
  subscriptions:
    - backend_alpha
  interval: 10
  publish: true
  timeout: 10
  runtime_assets:
    - http-checks
EOF
cat << EOF | sensuctl create
---
type: CheckConfig
api_version: core/v2
metadata:
name: check_alpha_backend_health
spec:
command: http-json --url http://sensu-backend-alpha:8080/health --query ".ClusterHealth.[0].Healthy" --expression "== true"
subscriptions:
- backend_beta
interval: 10
publish: true
timeout: 10
runtime_assets:
- http-checks
EOFcat << EOF | sensuctl create
{
"type": "CheckConfig",
"api_version": "core/v2",
"metadata": {
"name": "check_beta_backend_health"
},
"spec": {
"command": "http-json --url http://sensu-backend-beta:8080/health --query \".ClusterHealth.[0].Healthy\" --expression \"== true\"",
"subscriptions": [
"backend_alpha"
],
"interval": 10,
"publish": true,
"timeout": 10,
"runtime_assets": [
"http-checks"
]
}
}
EOFcat << EOF | sensuctl create
{
"type": "CheckConfig",
"api_version": "core/v2",
"metadata": {
"name": "check_alpha_backend_health"
},
"spec": {
"command": "http-json --url http://sensu-backend-alpha:8080/health --query \".ClusterHealth.[0].Healthy\" --expression \"== true\"",
"subscriptions": [
"backend_beta"
],
"interval": 10,
"publish": true,
"timeout": 10,
"runtime_assets": [
"http-checks"
]
}
}
EOFA successful health check result will be similar to this example:
http-json OK: The value true found at .ClusterHealth.[0].Healthy matched with expression "== true" and returned trueMonitor external etcd
If your Sensu Go deployment uses an external etcd cluster, you’ll need to check the health of the respective etcd instances for your primary (Backend Alpha) and secondary (Backend Beta) backends.
NOTE: These examples use the sensu/http-checks dynamic runtime asset. Follow the instructions above to register sensu/http-checks if you have not previously registered it.
cat << EOF | sensuctl create
---
type: CheckConfig
api_version: core/v2
metadata:
  name: check_beta_etcd_health
spec:
  command: http-json --url http://sensu-etcd-beta:2379/health --query ".ClusterHealth.[0].Healthy" --expression "== true"
  subscriptions:
  - backend_alpha
  interval: 10
  publish: true
  timeout: 10
  runtime_assets:
  - http-checks
EOF
cat << EOF | sensuctl create
---
type: CheckConfig
api_version: core/v2
metadata:
name: check_alpha_etcd_health
spec:
command: http-json --url http://sensu-etcd-alpha:2379/health --query ".ClusterHealth.[0].Healthy" --expression "== true"
subscriptions:
- backend_beta
interval: 10
publish: true
timeout: 10
runtime_assets:
- http-checks
EOFcat << EOF | sensuctl create
{
"type": "CheckConfig",
"api_version": "core/v2",
"metadata": {
"name": "check_beta_etcd_health"
},
"spec": {
"command": "http-json --url http://sensu-etcd-beta:2379/health --query \".ClusterHealth.[0].Healthy\" --expression \"== true\"",
"subscriptions": [
"backend_alpha"
],
"interval": 10,
"publish": true,
"timeout": 10,
"runtime_assets": [
"http-checks"
]
}
}
EOFcat << EOF | sensuctl create
{
"type": "CheckConfig",
"api_version": "core/v2",
"metadata": {
"name": "check_alpha_etcd_health"
},
"spec": {
"command": "http-json --url http://sensu-etcd-alpha:2379/health --query \".ClusterHealth.[0].Healthy\" --expression \"== true\"",
"subscriptions": [
"backend_beta"
],
"interval": 10,
"publish": true,
"timeout": 10,
"runtime_assets": [
"http-checks"
]
}
}
EOFA successful health check result will be similar to this example:
http-json OK: The value true found at .ClusterHealth.[0].Healthy matched with expression "== true" and returned trueMonitor PostgreSQL
COMMERCIAL FEATURE: Access enterprise-scale PostgreSQL event storage in the packaged Sensu Go distribution. For more information, read Get started with commercial features.
If you’re using PostgreSQL for event storage, we recommend monitoring your PostgreSQL event store’s health.
The connection to PostgreSQL is exposed on Sensu’s /health endpoint, which provides information about the event store’s health.
PostgreSQL data from the /health endpoint will look like this example:
{
  "Alarms": null,
  "ClusterHealth": [
    {
      "MemberID": 3470366781180380700,
      "MemberIDHex": "302938336092857e",
      "Name": "sensu00",
      "Err": "",
      "Healthy": true
    },
    {
      "MemberID": 15883454222313069000,
      "MemberIDHex": "dc6d5d7607261af7",
      "Name": "sensu01",
      "Err": "",
      "Healthy": true
    },
    {
      "MemberID": 11377294497886210000,
      "MemberIDHex": "9de44510fb838bbd",
      "Name": "sensu02",
      "Err": "",
      "Healthy": true
    }
  ],
  "Header": {
    "cluster_id": 13239446193995635000,
    "member_id": 3470366781180380700,
    "raft_term": 1549
  },
  "PostgresHealth": [
    {
      "Name": "sensu_postgres",
      "Active": true,
      "Healthy": true
    }
  ]
}
To monitor PostgreSQL’s health from Sensu, create checks that use the http-json plugin from the sensu/http-checks dynamic runtime asset.
NOTE: These examples use the sensu/http-checks dynamic runtime asset. Follow the instructions above to register sensu/http-checks if you have not previously registered it.
After you register the sensu/http-checks dynamic runtime asset, create two checks (“healthy” and “active”) to monitor PostgreSQL’s health from Sensu.
Make sure to update the --url value with your backend address before running the commands to create the checks.
Run the following command to add the “healthy” check:
cat << EOF | sensuctl create
---
type: CheckConfig
api_version: core/v2
metadata:
  name: postgres_healthy_http_check
spec:
  command: http-json --url https://sensu.example.com:8080/health --query ".PostgresHealth.[0].Healthy" --expression "== true"
  round_robin: true
  publish: true
  interval: 60
  subscriptions:
  - system
  runtime_assets:
  - http-checks
EOF
cat << EOF | sensuctl create
{
"type": "CheckConfig",
"api_version": "core/v2",
"metadata": {
"name": "postgres_healthy_http_check"
},
"spec": {
"command": "http-json --url https://sensu.example.com:8080/health --query \".PostgresHealth.[0].Healthy\" --expression \"== true\"",
"round_robin": true,
"publish": true,
"interval": 60,
"subscriptions": [
"system"
],
"runtime_assets": [
"http-checks"
]
}
}
EOFRun the following command to add the “active” check:
cat << EOF | sensuctl create
---
type: CheckConfig
api_version: core/v2
metadata:
  name: postgres_active_http_check
spec:
  command: http-json --url https://sensu.example.com:8080/health --query ".PostgresHealth.[0].Active" --expression "== true"
  round_robin: true
  publish: true
  interval: 60
  subscriptions:
  - system
  runtime_assets:
  - http-checks
EOF
cat << EOF | sensuctl create
{
"type": "CheckConfig",
"api_version": "core/v2",
"metadata": {
"name": "postgres_active_http_check"
},
"spec": {
"command": "http-json --url https://sensu.example.com:8080/health --query \".PostgresHealth.[0].Active\" --expression \"== true\"",
"round_robin": true,
"publish": true,
"interval": 60,
"subscriptions": [
"system"
],
"runtime_assets": [
"http-checks"
]
}
}
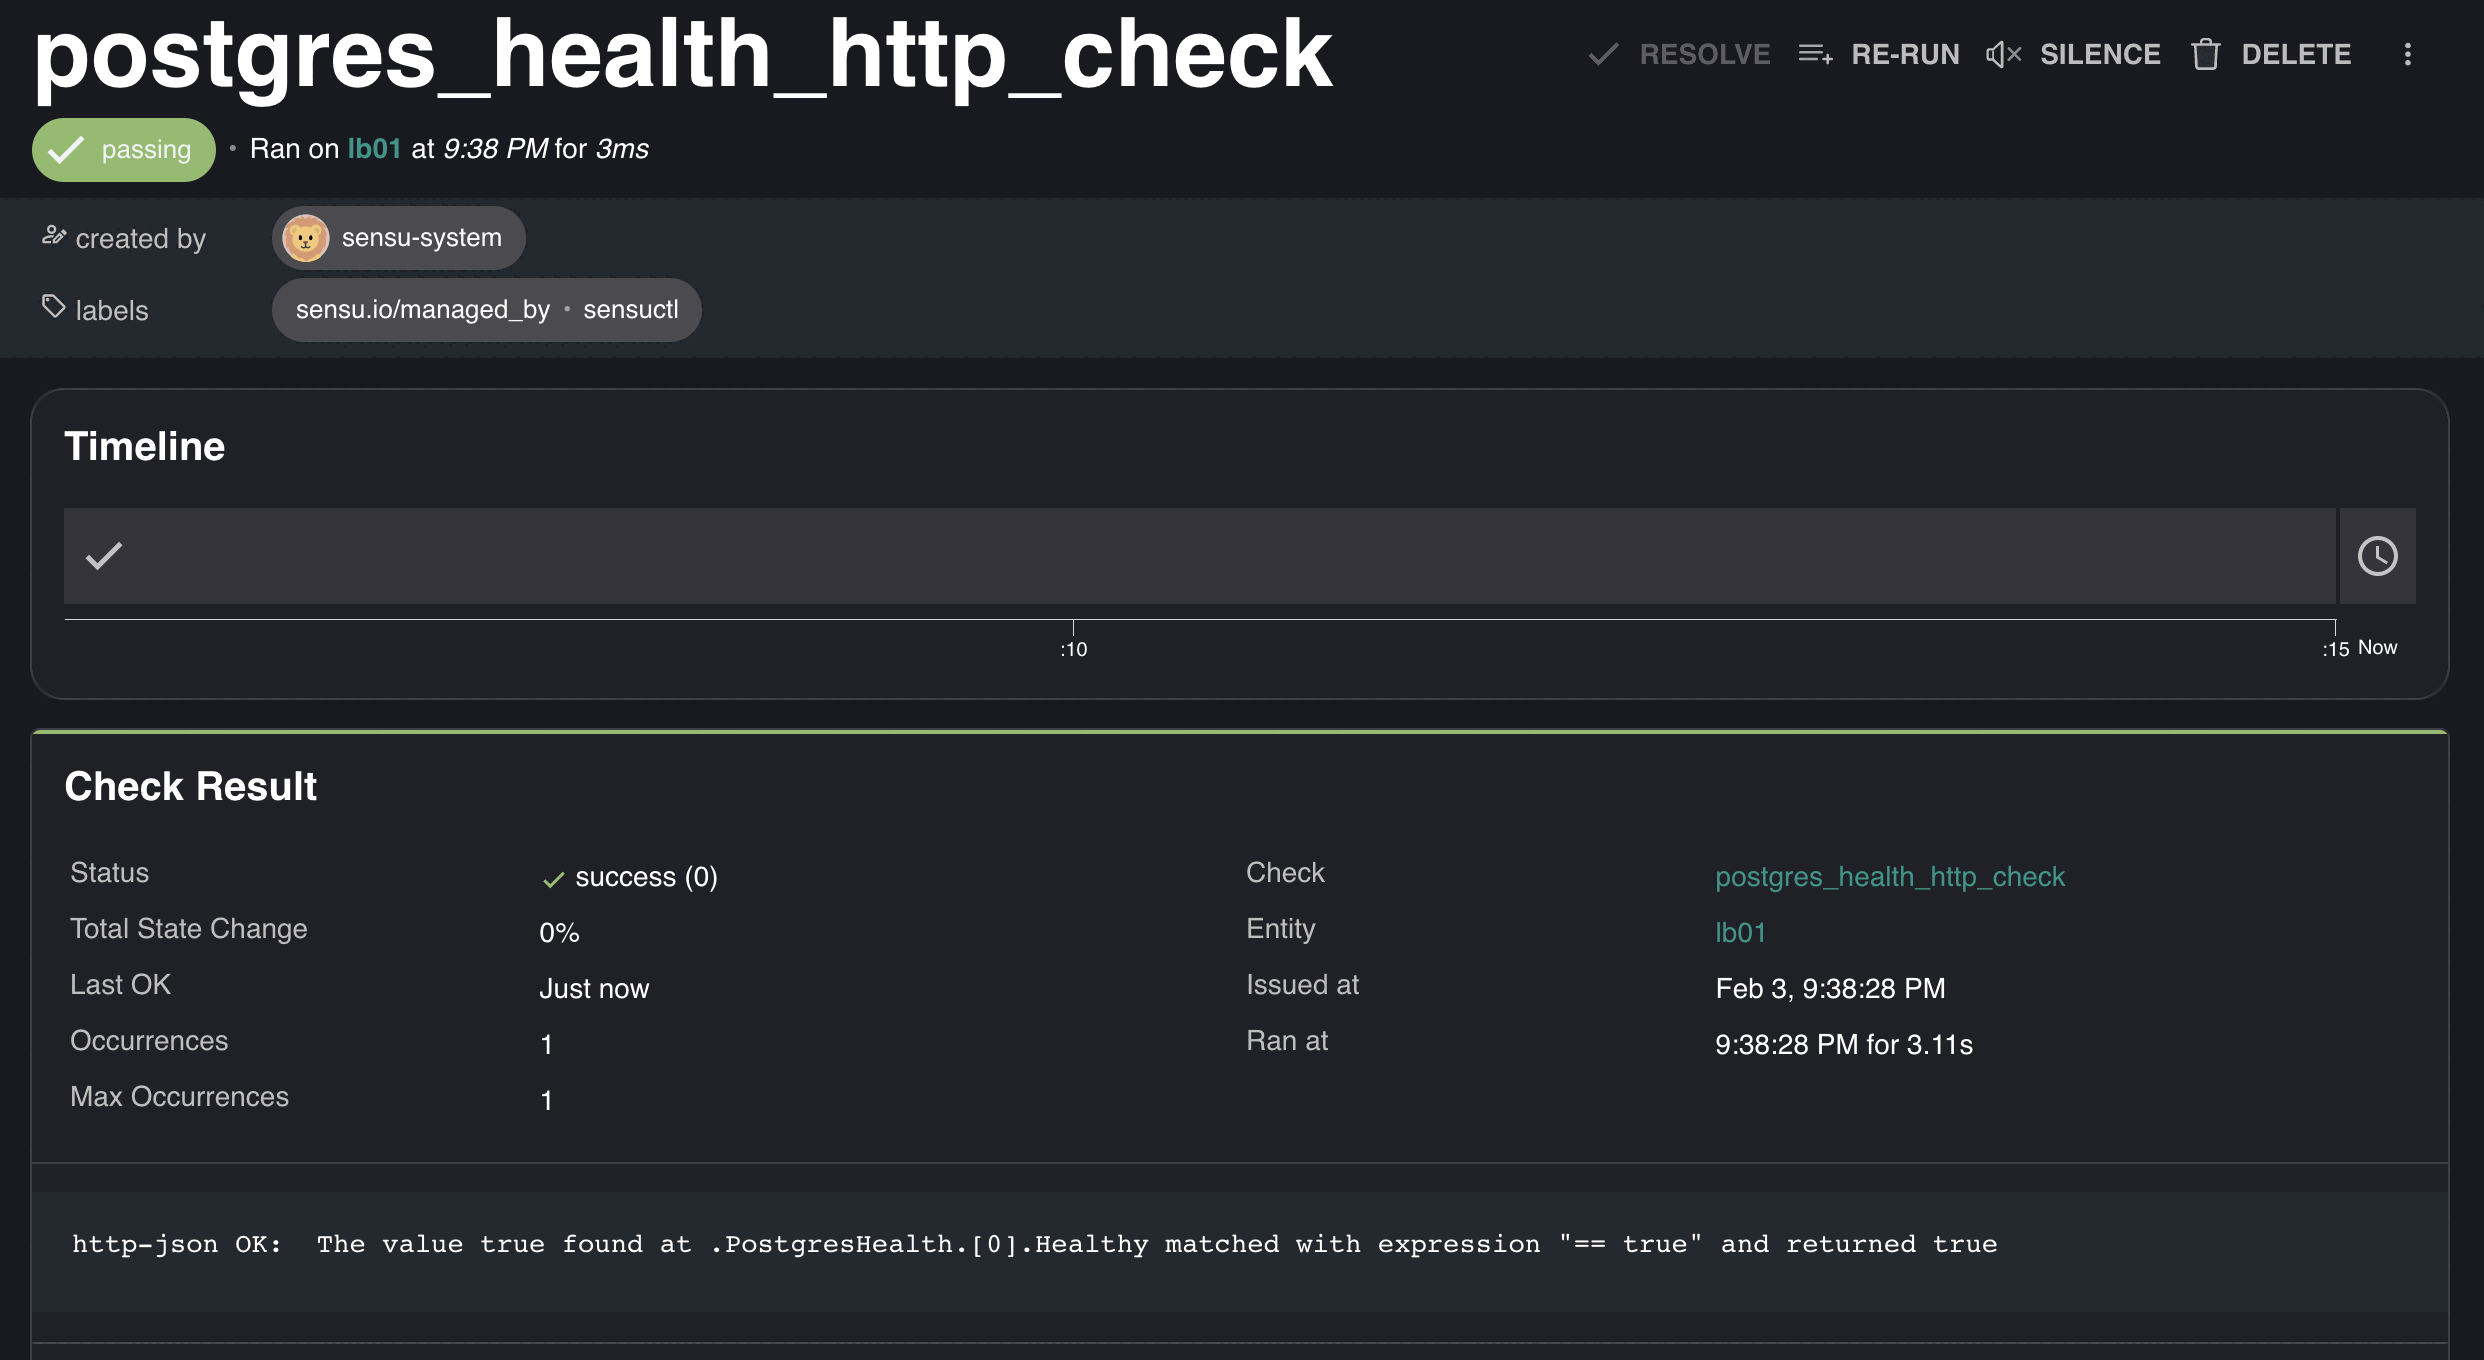
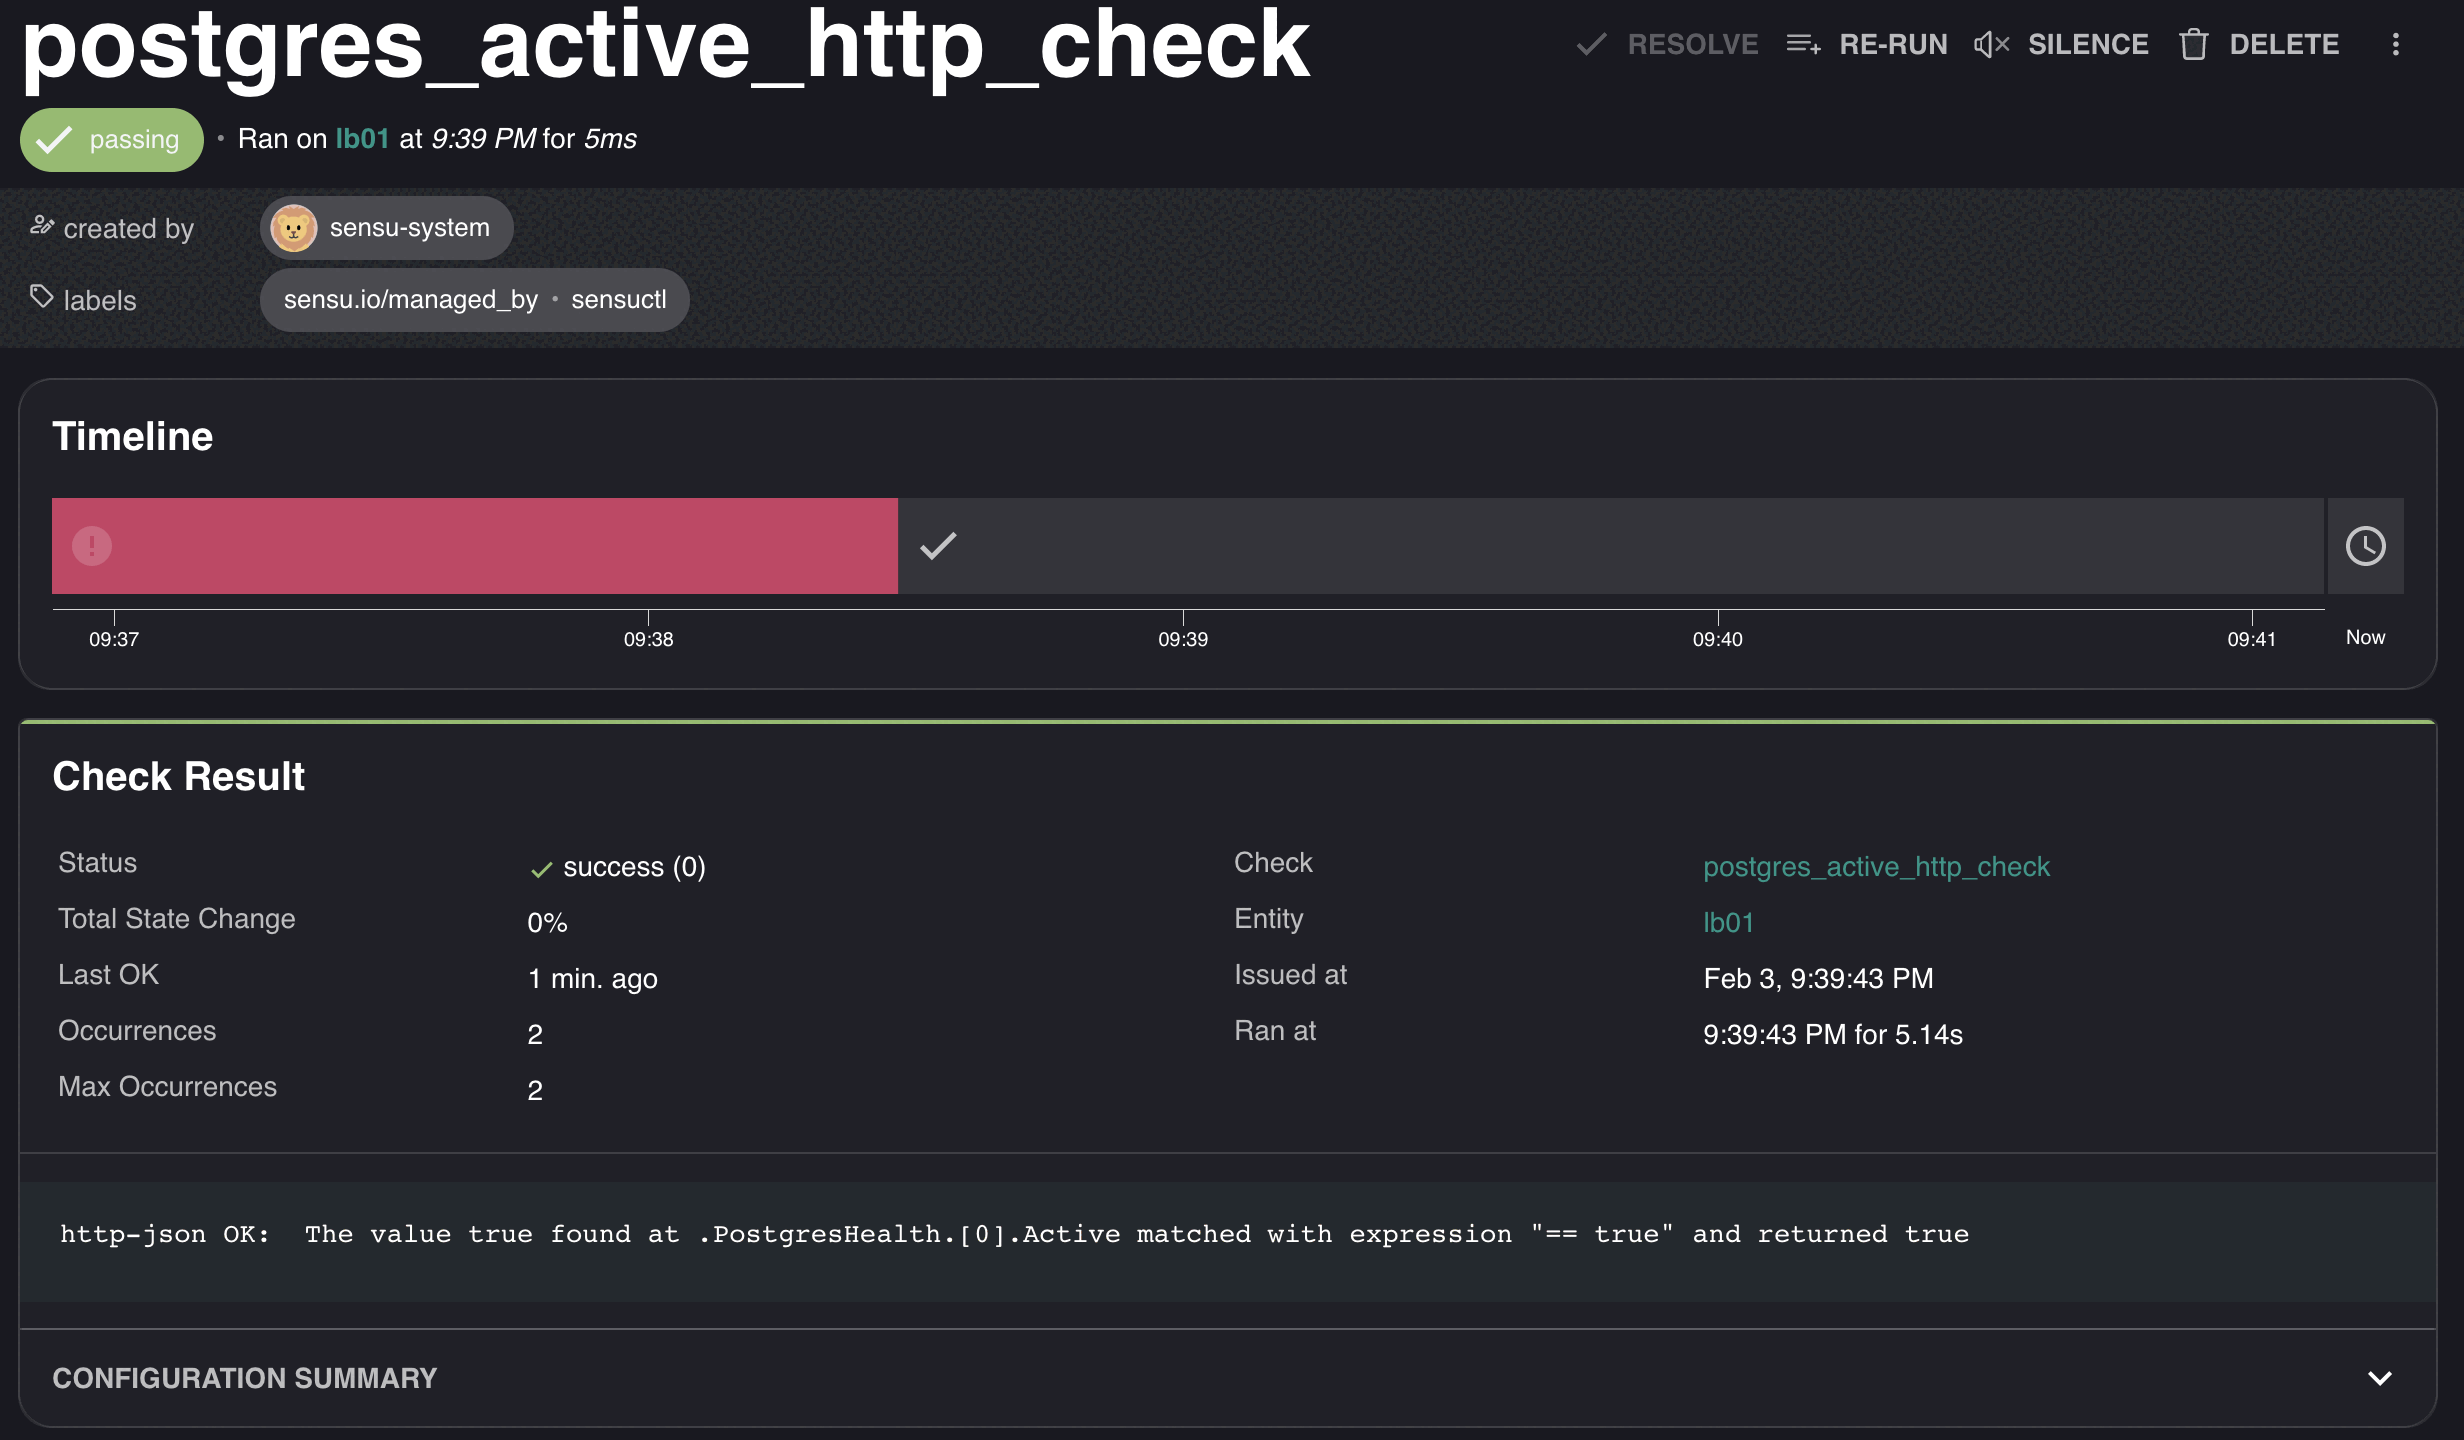
EOFSuccessful PostgreSQL health check results will be similar to this example:
http-json OK:  The value true found at .PostgresHealth.[0].Healthy matched with expression "== true" and returned true
http-json OK:  The value true found at .PostgresHealth.[0].Active matched with expression "== true" and returned true
In the Sensu web UI, you should see check results similar to these examples:
What’s next
To receive alerts based on your backend health checks, configure a pipeline with event filters and a handler and update your check definitions to reference the pipeline in the pipelines attribute.
Follow any of these guides to learn how to configure event filters, handlers, and pipelines and start sending alerts based on event data:
- Send email alerts with a pipeline
- Send PagerDuty alerts with Sensu
- Send Slack alerts with a pipeline
Read more about the Sensu features you used in this guide: